gRPC is quickly becoming the preferred tool for enabling quick, lightweight connections between microservices, but it also presents new problems for observability. This is mainly because gRPC connections apply stateful compression, which makes monitoring them with sniffing tools an extremely challenging task. At least, this was traditionally the case. But thanks to eBPF, gRPC monitoring has become much easier.
We at groundcover were thrilled to have the opportunity to collaborate with the Pixie project to build a gRPC monitoring solution that uses eBPF to trace gRPC sessions that use the gRPC-C library (which augments Pixie's existing eBPF-based gRPC monitoring for Golang applications).
In this blog post we will discuss what makes gRPC monitoring difficult, the challenges of constructing a user based eBPF solution, and how we integrated gRPC-C tracing within the existing Pixie framework.1 2
gRPC is a remote procedure call framework that has become widely used in microservice environments, and works in virtually any type of environment, offering implementations in all of the popular languages - including but not limited to Python, C#, C++ and PHP. This means you can use gRPC to do pretty much anything involving distributed applications or services. Whether you want to power machine learning applications, manage cloud services, handle device-to-device communications or do anything in between, gRPC has you covered.
Another reason to love gRPC is that it's (typically) implemented over HTTP/2, so you get long-lived, reliable streams. Plus, the protocol headers are compressed using HPACK, which saves a ton of space by avoiding transmission of repetitive header information. Yet, despite all this, gRPC implements its own API layer, so developers don't actually have to worry about the HTTP/2 implementation. They enjoy the benefits of HTTP/2 without the headache.
All of that magic being said, efficiency comes with a price. HTTP/2’s HPACK header compression makes the problem of tracing connections through sniffers much more difficult. Unless you know the entire session context from when the connection was established, it is difficult to decode the header information from sniffed traffic (see this post for more info and an example).
On its own, gRPC doesn’t provide tools to overcome this problem. Nor does it provide a way to collect incoming or outgoing data, or report stream control events, like the closing of a stream.
What we need is a super power - one that will enable us to grab what we need from the gRPC library itself, rather than trying to get it from the raw session.
This is exactly what eBPF enables. Introduced in 2014, eBPF enables observability of system functions in the Linux kernel, alongside powerful usermode monitoring capabilities - making it possible to extract runtime information from applications. Although eBPF is still maturing, it is rapidly becoming the go-to observability standard for Kubernetes and a variety of other distributed, microservices-based environments where traditional approaches to monitoring are too complicated, too resource-intensive or both.
Recognizing the power of eBPF as a gRPC monitoring solution, Pixie implemented an eBPF-based approach for monitoring gRPC sessions involving golang applications. Inspired by the benefits of that work to the community, we at groundcover decided to expand the eBPF arsenal to support gRPC monitoring in even more frameworks and programming languages, by monitoring the gRPC-C library.
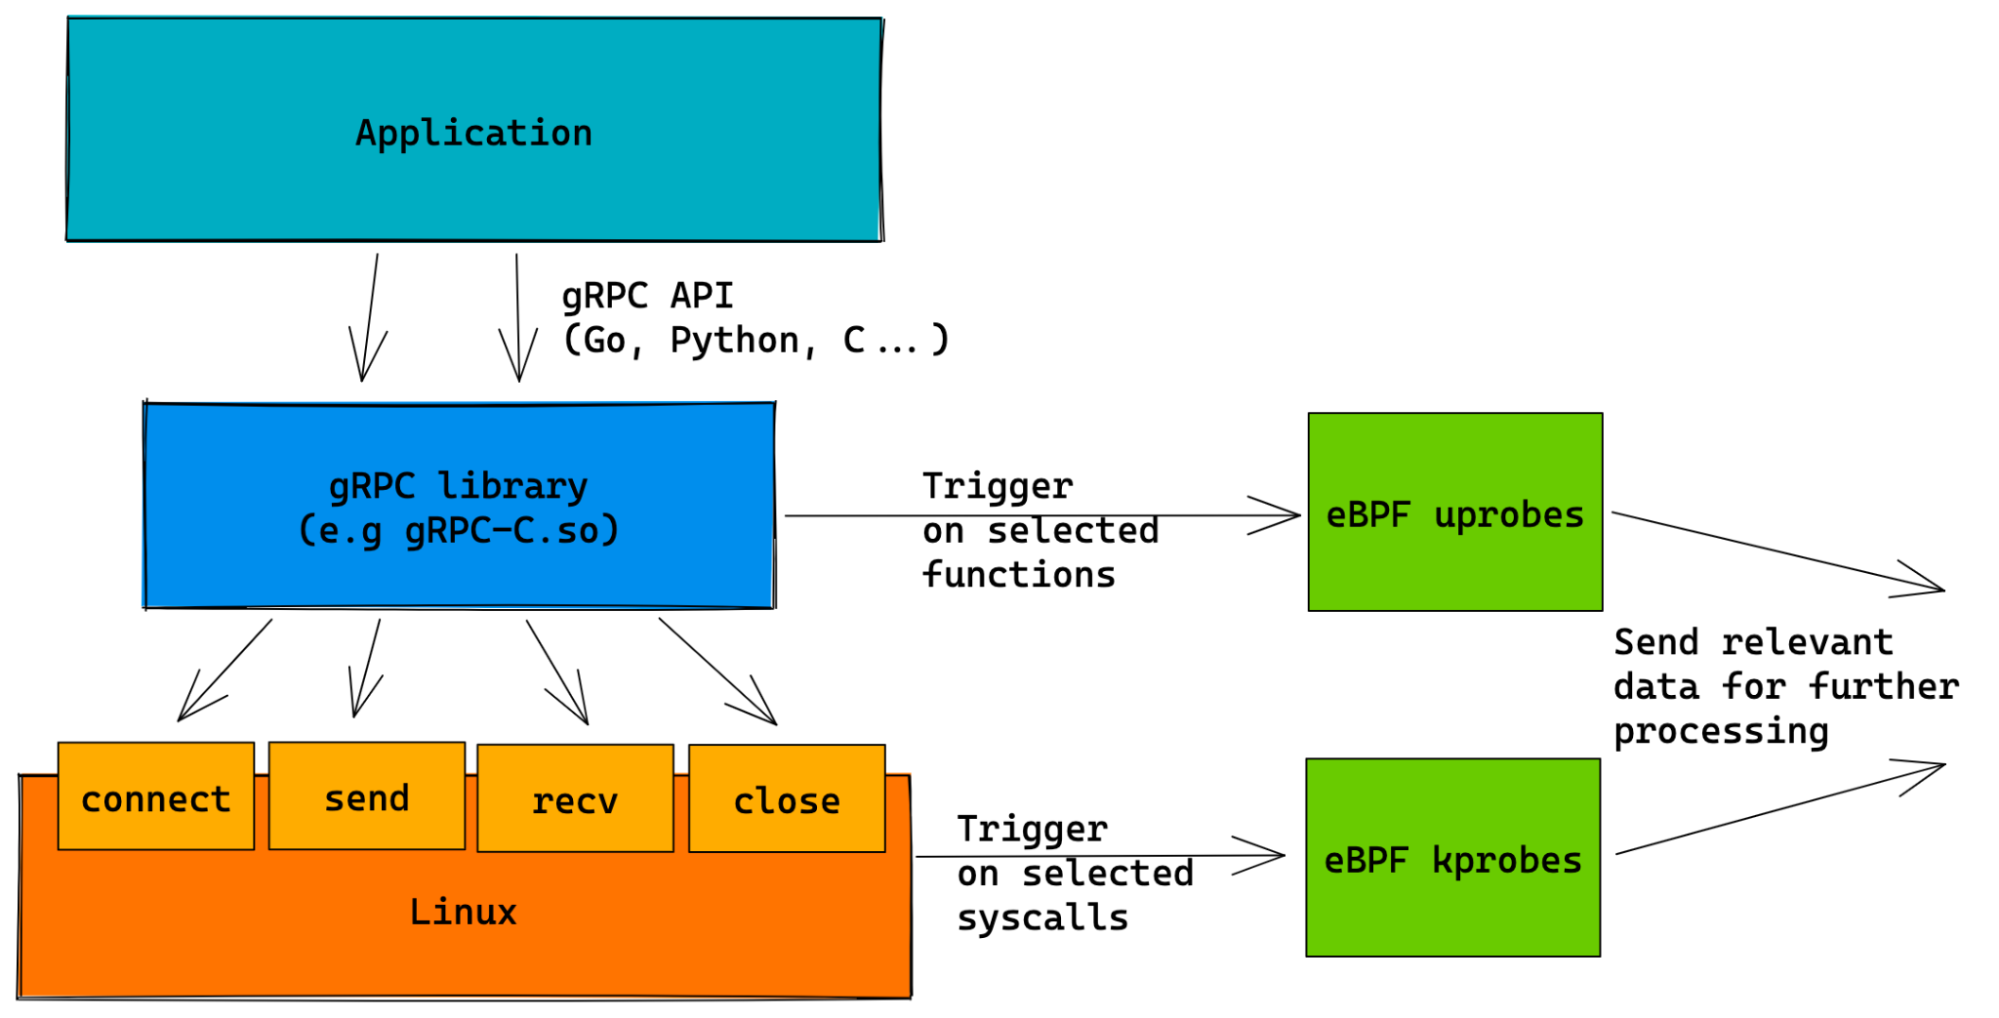
Before diving into gRPC-C specifics, the following diagram illustrates the general approach to tracing gRPC with eBPF:

Using a mixture of uprobes and kprobes (eBPF code which triggers on user functions and kernel functions, respectively), we are able to collect all of the necessary runtime data to fully monitor gRPC traffic.
While the kprobes are agnostic to the gRPC library used (e.g Go-gRPC, gRPC-C), the uprobes are tailored to work with the specific implementations. The rest of the blog post will describe the gRPC-C specific solution.
Among the different implementations of gRPC, gRPC-C stands out as one of the more common variations, as it is used by default in many popular coding languages - Python, C, C# and more.
Our mission was to achieve complete gRPC observability - meaning the ability to observe both unary and streaming RPCs - for environments which use the gRPC-C library. We did so by tracing all of the following:
- Incoming and outgoing data
- Plaintext headers (both initial and trailing)
- Stream control events (specifically, closing of streams)
Before getting into the bits and bytes, it’s important to first describe the structure of the solution. Following the general uprobe tracing schema described in the diagram above, we implemented the following 3 parts:
- The eBPF programs that are attached to the gRPC-C usermode functions. Note that even though the functions belong to userland, the code runs in a kernel context
- The logic to parse the events that are sent from the eBPF programs to the usermode agent
- The logic to find instances of the gRPC-C library, identify their versions and attach to them correctly
To help ensure that everything integrates nicely with the existing framework, we made sure our gRPC-C parsers produce results in a format that the existing Pixie Go-gRPC parsers expect. The result is a seamless gRPC observability experience, no matter which framework it came from.
In this part we will elaborate on how we approached each of the tasks described above.3
Tracing incoming data turned out to be a relatively straightforward task. We simply probed the grpc_chttp2_header_parser_parse function. This is one of the core functions in the ingress flow, and it has the following signature:
grpc_error* grpc_chttp2_data_parser_parse(void* /*parser*/,grpc_chttp2_transport* t,grpc_chttp2_stream* s,const grpc_slice& slice,int is_last)
The key parameters to note are grpc_chttp2_stream and grpc_slice, which contain the associated stream and the freshly received data buffer (=slice), respectively. The stream object will matter to us when we get to retrieving headers a bit later, but for now, the slice object contains the raw data we are interested in.
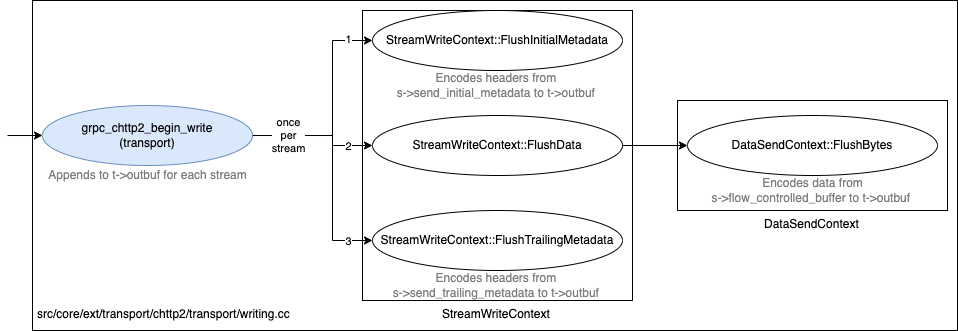
Tracing outgoing data proved to be a bit harder. Most of the functions in the egress flow are inlined, so finding a good probing spot turned out to be challenging.4

Central functions of the egress flow. All of the Flush_x functions are inlined in the compiled binary.
To solve the challenge, we ended up choosing the grpc_chttp2_list_pop_writable_stream function, which is called just before the Flush_x functions are called. The function iterates over a list of gRPC Stream objects that have data ready for sending, and it returns the first one available. By hooking the return value of the function, we get the Stream object just before the data is encoded in the Flush_x functions - exactly what we are looking for!
/* for each grpc_chttp2_stream that's become writable, frame it's data(according to available window sizes) and add to the output buffer */while (grpc_chttp2_stream* s = ctx.NextStream()) {StreamWriteContext stream_ctx(&ctx, s);size_t orig_len = t->outbuf.length;stream_ctx.FlushInitialMetadata();stream_ctx.FlushWindowUpdates();stream_ctx.FlushData();stream_ctx.FlushTrailingMetadata();
grpc_chttp2_stream* NextStream() {if (t_->outbuf.length > target_write_size(t_)) {result_.partial = true;return nullptr;}grpc_chttp2_stream* s;if (!grpc_chttp2_list_pop_writable_stream(t_, &s)) {return nullptr;}return s;}
Tracing incoming and outgoing data is great, but it’s not enough to deliver full observability. Most of the context in gRPC is passed over the request and response headers. This is where you'll find out which resource is being accessed, what the request and response types are, and so on. Because the headers are encoded as part of the protocol, (which makes them particularly hard to access, as we noted above) extracting their plaintext form is our next objective.
Looking at the functions we already found for data extraction, it seems we are in luck. Part of the logic in these functions deals with header encoding and decoding - for example, the FlushMetadata functions described above. We should be able to find plain text headers inside the same probe.
In practice, however, we noticed that for some cases, some of the headers were missing. Further examination of the codebase led us to two other relevant functions, which we thought could help us find the missing pieces:
void grpc_chttp2_maybe_complete_recv_initial_metadata(grpc_chttp2_transport* t,grpc_chttp2_stream* s);void grpc_chttp2_maybe_complete_recv_trailing_metadata(grpc_chttp2_transport* t,grpc_chttp2_stream* s);
This is a good example of just how powerful and dynamic eBPF is - if at first you don’t succeed, probe, probe again. With minimal time and effort we were able to place new probes on those functions, and to our delight, found the missing headers. Mystery solved!
The last bit of information we need for observability centers on stream control events – particularly the closing of streams. This data is important because it lets us “wrap up” each individual request/response exchange over long-living connections.
Getting this data turned out to be easy enough. We simply probed the grpc_chttp2_mark_stream_closed function, which is called when a given stream is closed for reading, writing or both. Sometimes, it’s just that simple. 🙂
The functions we walked through above allowed us to get the gRPC observability data we needed from our environment.
However, one tricky thing about eBPF is that eBPF usermode programs are far less portable than they would ideally be. This is mainly due to the sheer amount of usermode code which exists. There is no easy way to formalize a central solution such as the CO-RE project, making portability a hassle. Code that works for us may not work for someone else.
We were cognizant of this challenge, and we took several steps to address it.
First, the functions we chose for probing are fitting in more than one way. Not only do they give us what we need, but, equally important, they continue to exist between major versions of the library - both in source code and compiled binaries. As far as we know, they are a stable safe haven in an ever changing codebase landscape.
However, it’s important to note that when dealing with uprobes, there are no real guarantees. Even the seemingly most stable functions could change and vanish completely as the codebase evolves, requiring additional work to keep the eBPF code functional.
We know which functions we want to probe, but knowing is only half the battle. We still have to make sure the eBPF loader can find the functions. When probing the kernel itself or usermode applications that have debug symbols, this is trivial - we just need the name of the function (note that for C++ this would be the mangled name). However, we quickly noticed that newer compiled versions of the gRPC-C library are stripped, with all debug symbols removed. Naively trying to attach to those binaries will fail, as the eBPF loader can’t figure out where in the binary the functions are located.
Fear not! The functions are there - we just need to find them. And fortunately, this is not our first reverse engineering rodeo - so we know that Ghidra and other RE methods can be used to locate the functions. Let’s look at the following example:
Strings are easy to find inside binaries. Source code:
gpr_log(GPR_INFO, "%p[%d][%s]: pop from %s", t, s->id,t->is_client ? "cli" : "svr", stream_list_id_string(id));
Decompiled binary:
uVar3 = gpr_log("src/core/ext/transport/chttp2/transport/stream_lists.cc",0x47,1,"%p[%d]%s]: pop from %s",param1,*(undefined4 *)(pgVar1 + 0xa8),puVar2,"writable");}return uVar3 & 0xffffffffffffff00 | (ulong)(pgVar1 != (grpc_chttp2_stream *)0x0);
The code snippet above is taken from the stream_list_pop function, which is called by the grpc_chttp2_list_pop_writable_stream function we use as part of our solution. The log string that it prints out is unique, making it easy enough to find in the binary. Using this approach, we could either write a script that locates the functions beforehand in each Docker image and use a hashmap to track which binary uses which version, or get this information at runtime through the eBPF agent.
As structs in the gRPC-C library shift and evolve, the order and size of their fields may vary. Changes such as these immediately affect our eBPF code, which needs to traverse different objects in the memory to find what it needs. Let’s look at an example:
grpc_chttp2_incoming_metadata_buffer_publish(&s->metadata_buffer[1], s->recv_trailing_metadata);
Accessing the same grpc_chttp2_stream struct members means different offsets in the resulting binaries. For example the offsets for v1.24.1:
grpc_chttp2_incoming_metadata_buffer_publish((grpc_chttp2_incoming_metadata_buffer *)(param_2 + 0x420),*(grpc_metadata_batch **)(param_2 + 0x170));
And the offsets for v.1.33.2:
grpc_chttp2_incoming_metadata_buffer_publish((grpc_chttp2_incoming_metadata_buffer *)(param_2 + 0x418),*(grpc_metadata_batch **)(param_2 + 0x168));
This code snippet is taken from the grpc_chttp2_maybe_complete_recv_trailing_metadata function, which we use for retrieving the trailing headers of the stream. In order to do so, we traverse the s→recv_trailing_metadata object - so we have to know the offset of this field inside grpc_chttp2_stream. However, as seen in the decompiled code, the offset can change for different versions. This means that whenever a new version of the gRPC-C library is released, the tracing code needs to be checked against that version and potentially updated to read the appropriate offset:
// Offset of recv_trailing_metadata inside a grpc_chttp2_stream objectcase GRPC_C_V1_24_1:offset = 0x170;break;case GRPC_C_V1_33_2:offset = 0x168;break;…BPF_PROBE_READ_VAR(&dst, (void*)(src+offset));
Monitoring gRPC requests wasn't a trivial task – at least until eBPF came around.
Today, with the help of eBPF functions, we can get the data we need to achieve gRPC observability. Specifically, we can trace data, headers and stream closes. Finding the right functions to achieve these tasks was not simple, as we demonstrated above. But with a little trial and error (and a bit of help from software reverse engineering tools), we were able to build a solution that will work reliably, even as eBPF continues to evolve.
1 Code changes required to implement gRPC-C tracing in Pixie: pixie-io/pixie/pull/415, pixie-io/pixie/pull/432, pixie-io/pixie/pull/520, and pixie-io/pixie/pull/547.
2 The list of currently supported gRPC-C versions can be found here.
3 All source code snippets were taken from gRPC-C version 1.33.
4 eBPF requires the functions to exist as actual functions, which is the opposite of inlining. For example, think about what happens when trying to add a probe at the end of an inlined function. Since the function was inlined, the return instructions are completely gone, and there’s no simple way to find the correct point to hook.
Terms of Service|Privacy Policy
We are a Cloud Native Computing Foundation sandbox project.
Pixie was originally created and contributed by New Relic, Inc.
Copyright © 2018 - The Pixie Authors. All Rights Reserved. | Content distributed under CC BY 4.0.
The Linux Foundation has registered trademarks and uses trademarks. For a list of trademarks of The Linux Foundation, please see our Trademark Usage Page.
Pixie was originally created and contributed by New Relic, Inc.


